
The Case of the Missing Signups: Storemapper’s Data-Driven Diagnosis
.png)
When an important customer metric suddenly drops, it rarely happens in a vacuum. When signups dip, new customers, revenue, and traffic tend to fall with them. From there, you can often triangulate to figure out the issue at hand.
But what do you do when a primary metric falls, but all the other data appears to look the same?
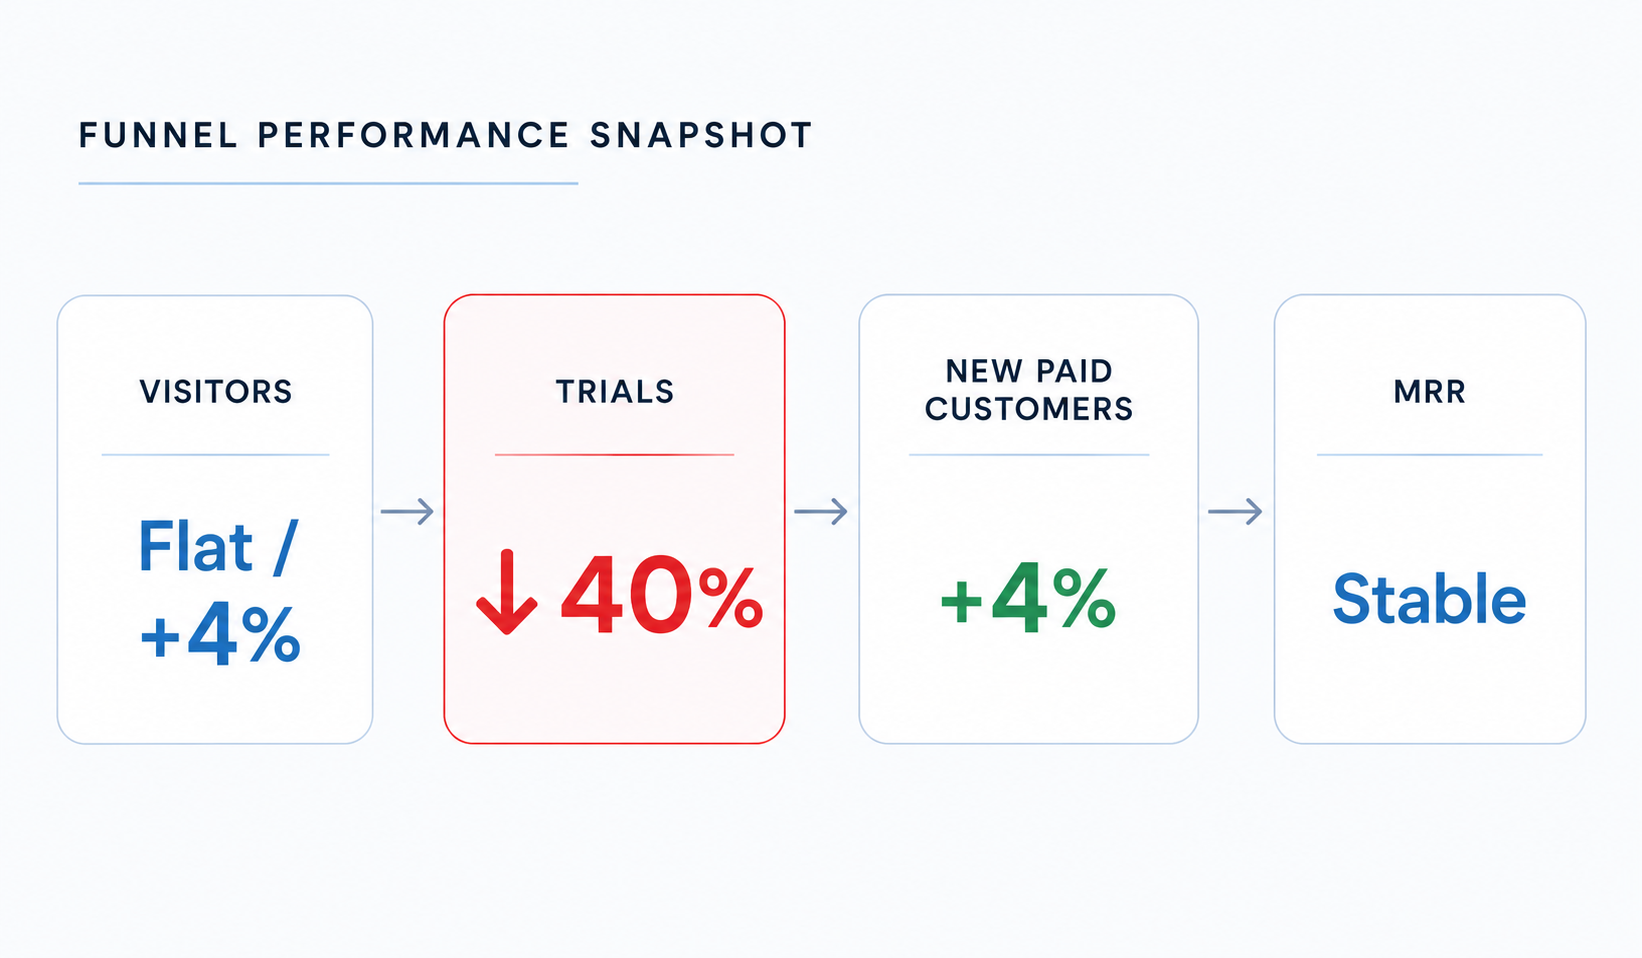
That's the situation the team at Storemapper recently found themselves in. They noticed a steady decline in the number of trial signups for their store locator tool, but traffic and new paid customer numbers were holding strong, and revenue hadn't changed at all.
While it would've been easy for the team to run with the first plausible theory, it's fortunate that they didn't, as initial assumptions would later turn out to be incorrect. Led by Julia Fertig, Product Marketing Manager at Storemapper, the team chose to source their answers from the data alone. In this article, Julia shares how she was able to use the data to figure out the real issue by tracing the decline across several analytics tools and harnessing AI to speed up the process.
What she found is a great case study in resisting the urge to jump to conclusions. Her investigation offers a useful lesson for businesses watching a number drop without an obvious explanation. Today, we’ll chat with Julia about what she learned, how she uncovered the right answers, and what she took away from the experience. Let’s get into it!
Table of Contents
- The risk of jumping to conclusions
- How Storemapper investigated the signup drop
- Why Storemapper’s signups were declining
- How AI helped speed up the search
- Turning the diagnosis into action
- Conclusion
The risk of jumping to conclusions
When the signup numbers first went down, the Storemapper team wasn't particularly worried. The drop showed up in one of their weekly metrics meetings, and it was small enough that it could have been attributed to almost anything.
"We just thought it might be due to a new competitor or a keyword that dropped in ranking," Julia explains. "Nothing that huge."
The team decided to wait a couple weeks to see if the trend reversed on its own. It didn't, and by then, a more convincing theory had taken shape around Storemapper's recently redesigned onboarding flow.
"Our main assumption before looking at the data was that it was from our updated onboarding process," Julia says. "We changed the onboarding, and then the issue started, so naturally, we immediately thought they were connected."
Acting on that assumption would have meant days of development work to roll back the new onboarding, time that would otherwise go toward customer requests and bug fixes. And the rollback itself would have hurt them, because the new onboarding was working: paid conversion had improved, and fewer users were deleting their accounts the same day they’d signed up.
"Imagine if we just went along with the assumption and rolled back to the old onboarding," Julia says. "We would’ve also then dealt with lower signups and fewer paid customers. It certainly would’ve affected our MRR."
Julia is candid about why teams tend to reach for the nearest explanation instead of digging into the numbers.
"It's easier to just create an assumption and act from it, rather than looking into all of the data, which can be a lot of work and hassle," she says. "But it's always worth it."
How Storemapper investigated the signup drop

Before digging into the numbers, the team started with the basics. They walked through the entire user flow themselves, from landing page to signup, checking whether anything was broken along the way. Nothing was.
Then Julia turned to the onboarding theory. Storemapper uses PostHog, a product analytics tool that captures session recordings, which meant she could watch exactly how users were experiencing the new flow.
"I looked at more than a hundred recordings," she says. "Users were moving smoothly through the entire onboarding flow, adding new stores – getting to the ‘aha’ moment we want them to reach."
The metrics told the same story. Paid conversion was up, same-day account deletions were down, and Storemapper's developer had combed through the backend to confirm nothing technical was interfering.
"Everything after the signup had actually improved," Julia says. "So we knew the issue had to be happening beforehand."
That conclusion narrowed the search, but it also revealed the next obstacle: Storemapper's acquisition data lived in several different tools. The team uses Stripe for website customers and Shopify for customers who come through the app store, along with Baremetrics, Google Analytics, Google Search Console, and Semrush. Each tool tracked something the others didn't.
"In one tool, we had the plan each user was paying for, but in another, we only had the date they joined," Julia explains. "So I had to cross-check everything."
Reconciling all of it confirmed what the team was up against. Visitors and paid customers had held steady over that stretch, even while signups were decreasing. Then, Google Search Console produced the first real clue: clicks had dropped abruptly on three specific pages. The homepage, the pricing page, and the live demo page had each lost nearly half their monthly visitors.
"Those are three high-intent pages," Julia says. "That was my first clue."
Why Storemapper’s signups were declining
With three high-intent pages losing clicks, Julia went back to the keyword data, which is where the answer finally came to light. Storemapper's traffic hadn't shrunk, but the search terms bringing people in had shifted toward early-stage research.
"We lost the bridge between the top and bottom of the funnel," Julia says. "Those visitors would come once, leave, and never come back."
The site was pulling in plenty of people searching broad terms like "Google Maps API," visitors still researching their options who were nowhere near ready to purchase a store locator. Meanwhile, the middle of the funnel, the searches people make while they're comparing and evaluating, had thinned out. Storemapper had lost the pages and rankings that used to carry someone from their first visit to a trial signup.
It explained everything the team had been seeing. The visitor count remained the same, because discovery-phase traffic was replacing the evaluation-stage visitors Storemapper was losing. And paid customers held up, because buyers at the very bottom of the funnel could still find the site. Signups were the only metric that depended on the visitors who’d disappeared.
As for what caused the shift, Julia credits several factors working at once. Google's recent core updates had changed which pages rank for which searches, favouring specific, useful content like case studies and testimonials over generic homepages. Storemapper had also recently migrated its website and reworked its homepage, which affected the brand’s messaging. And finally, there's a factor nearly every business now must contend with: search behaviour itself is changing, with more people turning to AI tools like ChatGPT for questions they once typed into Google, as well as Google's own AI features answering questions before anyone clicks through.
In the end, nothing was wrong with the product or the conversion flow. Storemapper was drawing the same amount of traffic as before, but far fewer of those visitors were the kind who went from evaluation-stage shopping to trial signups. The problem had gone unnoticed, because visitor and revenue numbers held steady the whole time. This is why Julia cautions to be wary of reading too much into traffic alone.
How AI helped speed up the search
The investigation had one problem that AI was especially suited for: too much data in too many places. Storemapper's customer information was spread across half a dozen tools, and each tracked different fields.
"The most helpful thing AI did, by far, was analyze the data," Julia explains. "If I'd had to do that all by myself, it would've taken three or four times longer."
Julia exported the data from each platform and used AI to clean it, organize it, and cross-reference records across tools. She estimates that she was able to connect 70-80% of the data this way. It took over 200 messages back and forth across a full week. "I talked to AI like it was a person," she comments.
Once everything was in order, and the Search Console clues emerged, AI took on a second role: pressure-testing her theories. Julia wrote out a list of hypotheses about what might be causing the decline and asked AI to examine the evidence behind each one. She also built the same guardrails into every conversation.
"I always tell AI not to assume anything, and to ask me if it has questions," she says. "Then I ask, is there anything I've missed? What have I forgotten to consider? And there's always something I've missed,” she jokes. “Always."
The process also showed why Julia couldn't simply hand the analysis over. Early on, the AI told her that visitor numbers had dropped considerably year over year, a conclusion she recognized as wrong from a bot incident the year before. The bot had inflated traffic for a stretch, and even though the team had dealt with it at the time, the bogus numbers were still sitting in the exported data, where the AI took them at face value.
"I only knew it was wrong because of how well I know the data and the business," Julia says. "Otherwise, I would have accepted it and moved on, and we would’ve reached a completely different conclusion."
For Julia, that experience gets at the one rule she follows every time.
"You need to make sure you understand the data first," she says. "Then you can ask AI to clean it and organize it in a more intelligent way."
Turning the diagnosis into action
With the diagnosis in hand, the team mapped out the work: overhaul the Shopify app listing, update the homepage and pricing page, rebuild the live demo page, and restructure the blog’s internal link strategy.
"I asked, what can I do now that will improve our signups the fastest?" Julia says. "And it was Shopify. So we changed all of the images, the description, the feature list, everything we could."
Julia had also worked a competitor analysis into her research, and it informed the new listing copy. With some Shopify competitors now advertising lower entry prices, she focused the copy on the value behind Storemapper's plans, and on clearing away potential contentions before they come up, like making clear that users don't need their own API key to start a trial.
From there, Julia moved to the website, refreshing the homepage hero section, updating the schema markup, and retitling the pricing page. The live demo page, one of the three that had lost the most traffic, will get a fuller rebuild to support separate demos for different industries and use cases.
"It's the change I'm most excited about," she says.
The team is also rethinking the blog's role. Posts used to link mostly to other posts, so a reader could browse for a while without ever reaching the product. Now they route people toward pages like features and the live demo.
The investigation changed some team habits, too. Julia now keeps a monthly dashboard alongside the weekly numbers, since the drop that started all this was nearly invisible week to week.
"Looking at weekly data isn't good enough," she says. "You have to see the whole landscape."
The team also has a new rule for anomalies.
"If we see something off, for better or for worse, we never act on it that same week," Julia says. "Sometimes a bad week is just a bad week."
Conclusion
In the end, Storemapper's decline in signups was traced back to the latest changes in the ways people search online. Not only has Google changed the way it directs traffic, but AI tools now often replace what would’ve once been an informational website visit. As well, visitors to Storemapper’s site tended to be earlier in their research than before. But because the team's most-watched metrics stayed the same through all of it, weeks went by before the shift was noticeable.
Credit goes out to Julia for carefully testing the most likely theories, which required tasks like watching a hundred session recordings or spending a week stitching together records from every tool the team used. Julia wisely utilized AI throughout to save time, but made sure to back every AI conclusion with proper knowledge of the product and business. Thanks to her thorough work, not only was the team able to identify a set of solutions backed by the right data, but they were also saved from a rollback that would’ve cost them time and customers.
Storemapper's recovery is still in progress, and the fixes will take time to prove themselves. But the team is making changes with a clear picture of the problem, and results are already starting to show.
"It's easy to assume the cause is something you can already see," Julia says. "The data is there for exactly this reason. Follow it, and you'll find what's really going on."
Storemapper’s experience is one example of how SureSwift teams work through real growth challenges across the portfolio. You can read more stories like this in our Portfolio Spotlight series.

Related articles
.png)
.png)
When Automation Breaks, Support is the Product: Docparser on Delivering the “Best Customer Support”
In automation tools, reliability depends on more than the product itself. Learn how Docparser earned recognition for Best Customer Support by keeping complex workflows running reliably.
.png)
Expand Your Audience by Niching Down: Lessons from MeetEdgar GM Lacey Sheardown
Niching down can feel limiting, especially when competitors keep adding features. MeetEdgar’s GM Lacey Sheardown explains how refocusing on their core audience led to clearer product decisions and stronger growth.
